Dynamic Charts Builder Overview
This overview will describe the general settings of Dynamic Charts and how to create and customize them.
From this tutorial, you’ll find out everything about Dynamic Charts functionality from the JetEngine plugin. With Dynamic Charts, you can dynamically get the data from the previously created Query and display it in beautiful charts, such as Bar, Line, Pie, Geo, Histogram, and many others.
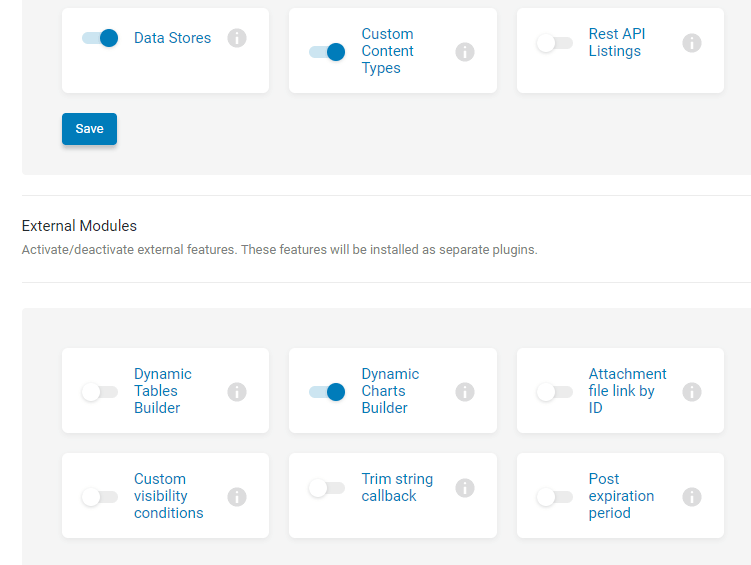
Enable the Dynamic Charts Builder module in JetEngine > JetEngine > Modules > External Modules.
After that, you need to create a Query with Query Builder.
Open the Charts Builder block in the JetEngine dashboard, and let’s have a closer look at all settings.
General Settings
- Name. Here you can add the name of the chart;
- Data Query. In this field, you need to choose the query you’ve created before with the Query Builder. No worries if you didn’t create it. There’s always an opportunity to create a new query or edit the existing one;
- Fetch the data. Fetch a sample of the data to find all possible columns and preview the table.
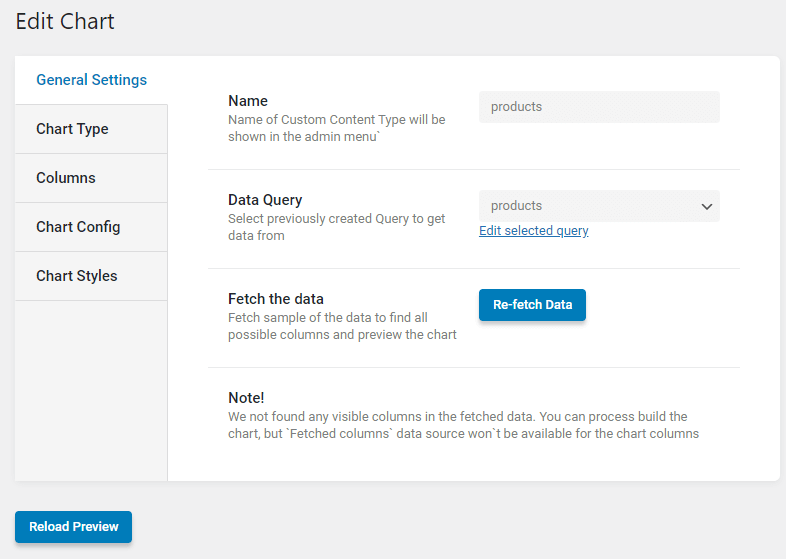
Chart Type
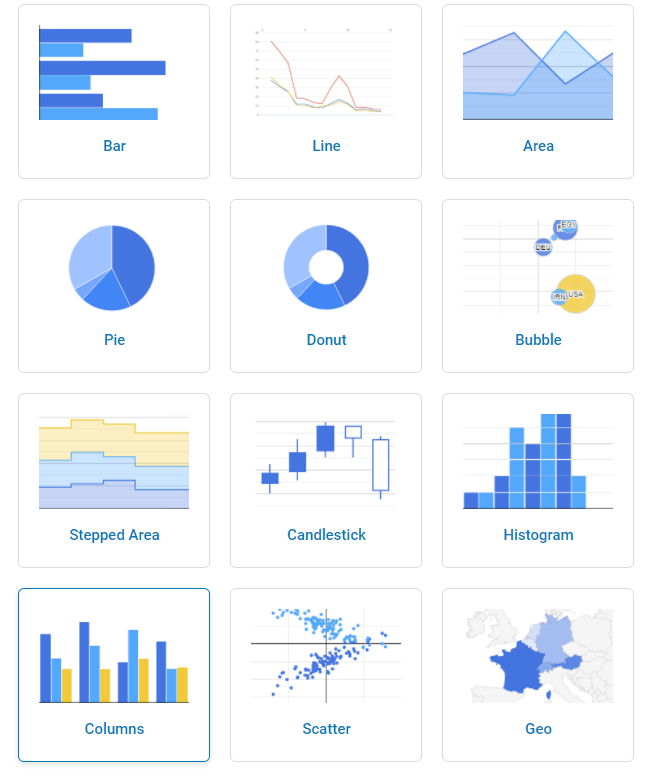
In this block, you can choose the chart type. Here you can see a lot of amazing charts, such as Bar, Line, Area, Pie, Donut, Columns, and many others. In our case, we’ll choose the Columns chart type.
Columns
Here you can add the required data for your chart. It will work similarly to the meta fields.
- Column Name. The column name is displayed in the table heading;
- Data Source. Here you can choose from two options – “Fetched Column” and “Post/Term/User/Object Field.” In our case, we have only the “Post/Term/User/Object Field” option because “Fetched Column” doesn’t work with WooCommerce;
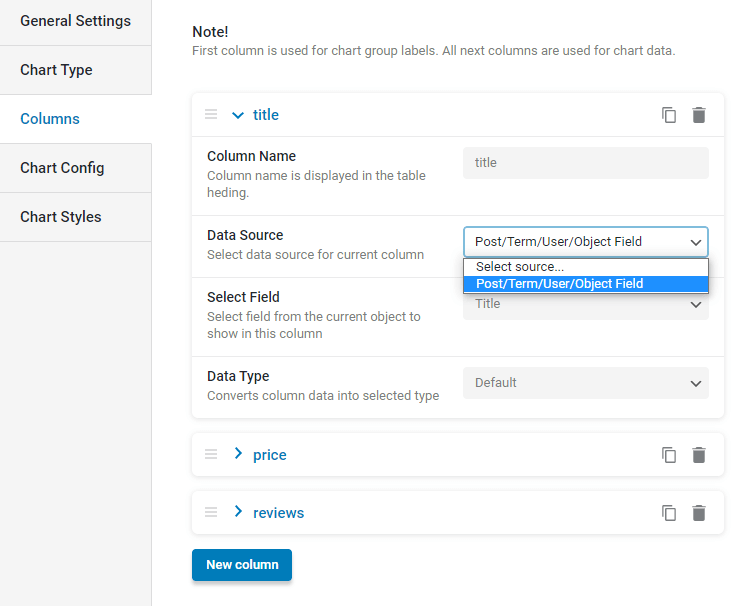
- Select Field. Select a field from the current object to be shown in this column. We’ve added title, price, and reviews fields to show the price-demand ratio for books;
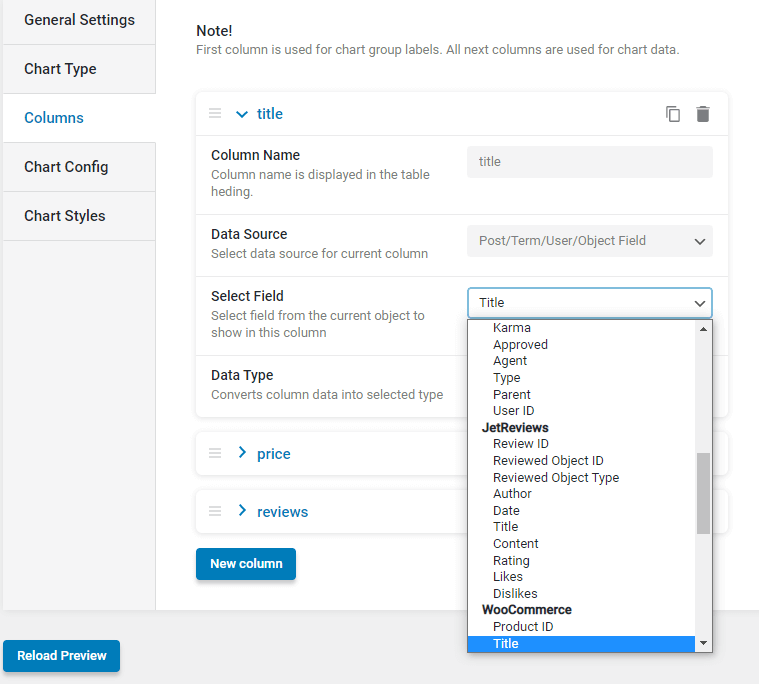
- Data Type. Converts column data into the selected type. You can choose between “Default,” “Ensure number,” and “Ensure string.” In our case, we’ve chosen “Ensure number”.

You can click on the “Reload Preview” button to check the changes.
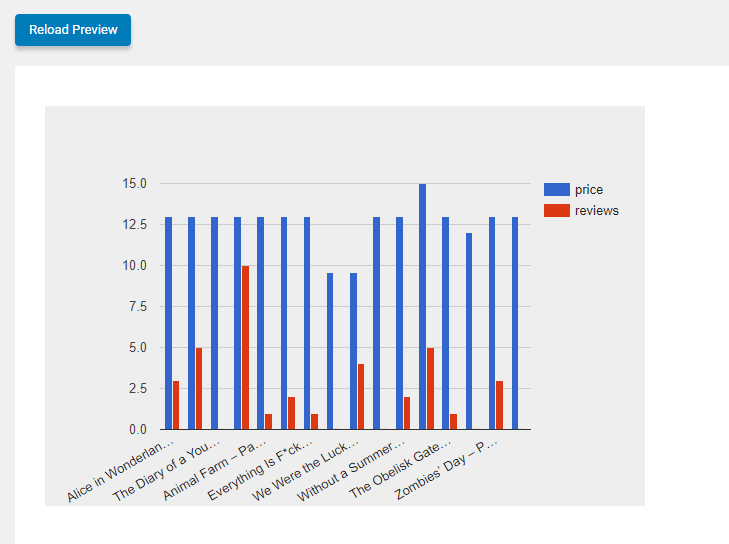
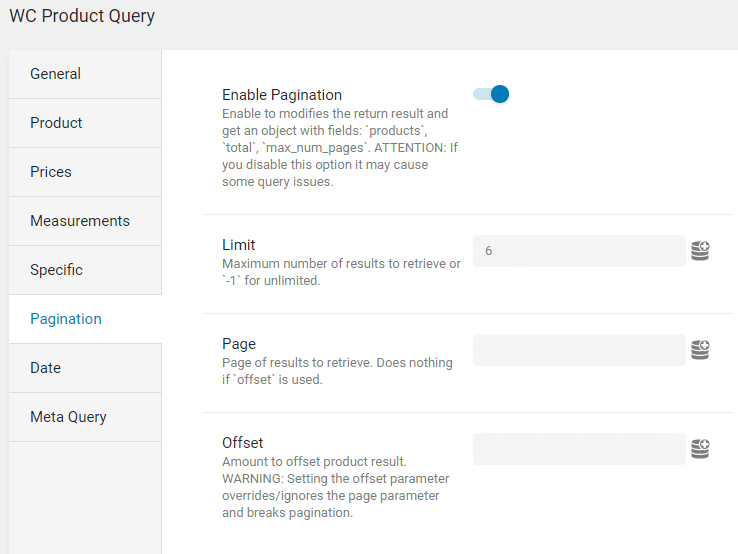
Also, if you want to display fewer products in the Chart, you can always use the limit from the Query Builder. Previously, we’ve created a WC Product Query. Now we need to return to it, open the Pagination section, enable the pagination option, and set the needed number of products per page in the Limit field. For example, I want to display only 6.
As a result, we’ll see only six products in the preview.
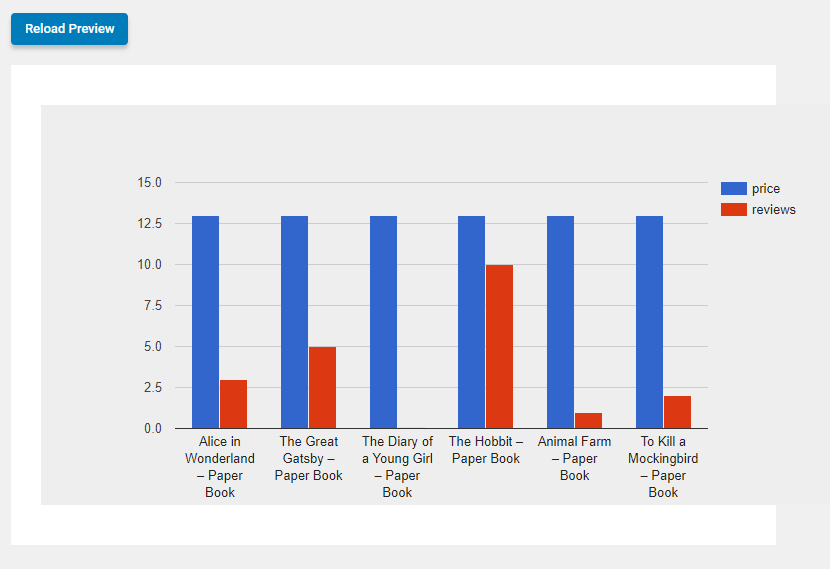
Chart Config
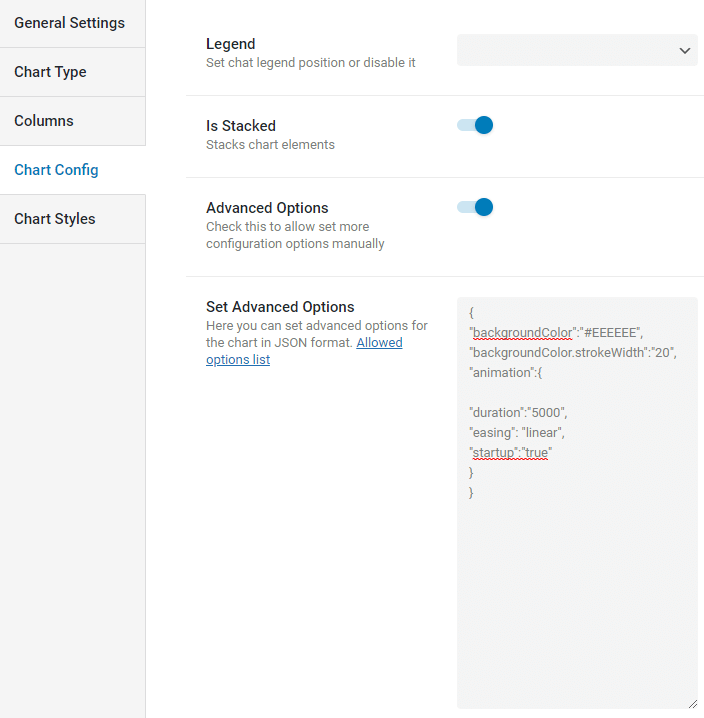
- Legend. Set the chart legend position or disable it;
- Advanced Options. This toggle allows you to set more configuration options manually. After you’ve enabled this option, the Set Advanced Options field will appear. Here you can set advanced options for the chart in JSON format. Please check the Allowed options list to see what you can add. We’ll add the following:
{
"backgroundColor":"#EEEEEE",
"backgroundColor.strokeWidth":"20",
"animation":{

"duration":"5000",
"easing": "linear",
"startup":"true"
}
}
Now let’s check the result.
Without Advanced Option, the chart would not be animated.
Chart Styles
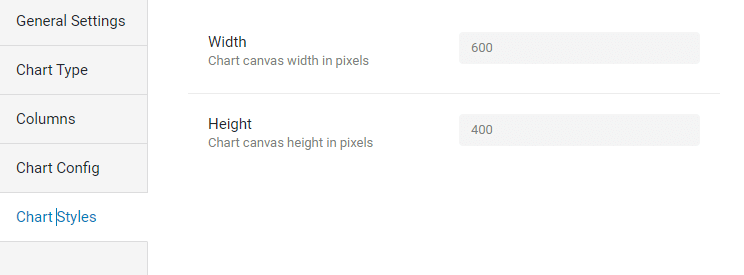
In this module, you can adjust the width and set the height for the chart in pixels.
Dynamic Chart Widget in Elementor
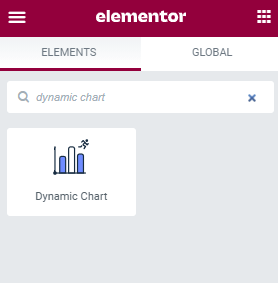
There’s an opportunity to display the chart on any page with a Dynamic Chart widget. Go to the needed page and click on the Edit with Elementor button. Search for the Dynamic Chart widget and add it to the page.
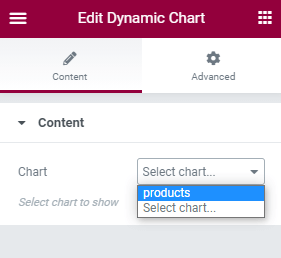
In the Chart field, you can choose the chart you’ve created before.
Dynamic Chart Block in Gutenberg
You can also add the Dynamic Chart widget in Gutenberg. Open the needed page, click on the plus icon, and search for the Dynamic Chart widget.
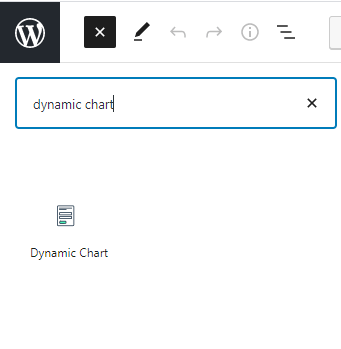
After that, you can simply add the widget to the needed section. In the widget’s settings, you’ll need to choose the Chart you’ve created before.
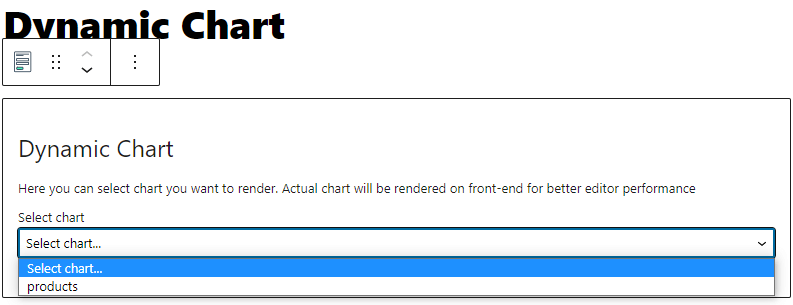
Let’s have a look at the chart on the front.
Now you know how to use Chart Builder from the JetEngine plugin to display data with the help of beautiful charts.