Query
Determine which data will be selected from the database and how.
Easy way to output dynamic data selections graphically. Use Charts Builder to pull data and visualize it through 10+ chart types.
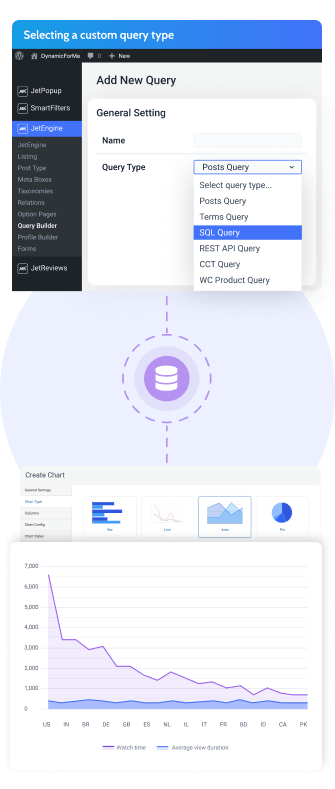
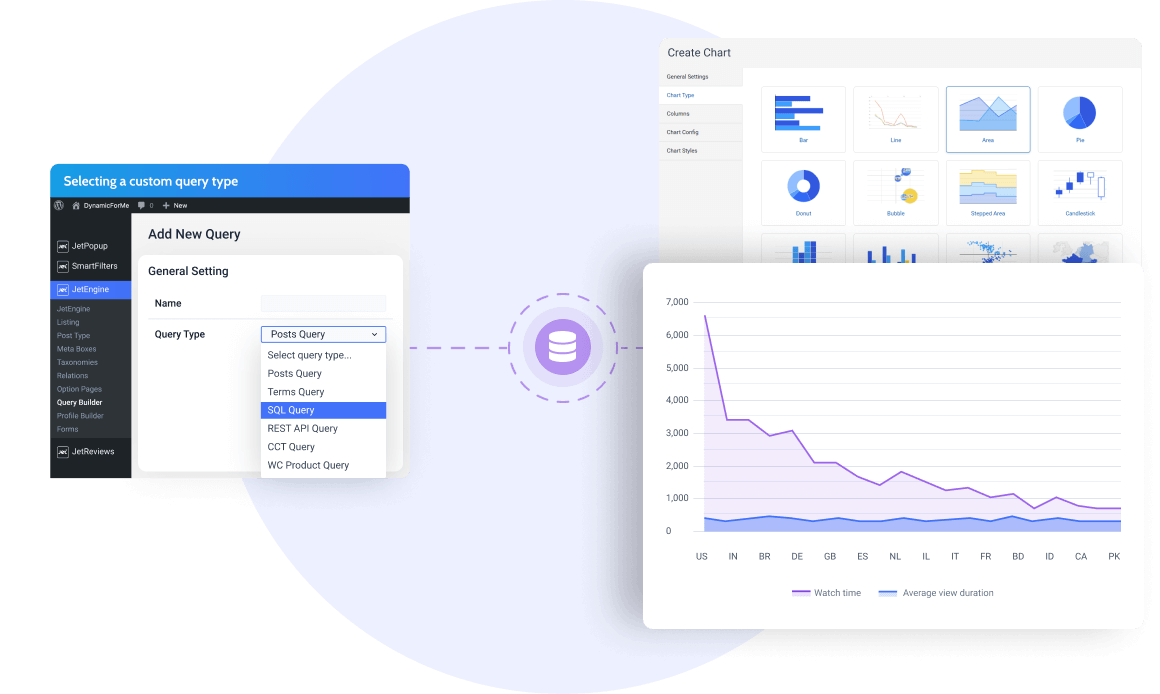
Determine which data will be selected from the database and how.
Fetch the query columns and use them as display options in the front.
Preview the chart content before placing it on the website page.
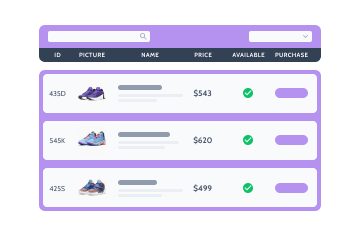
Want to turn graph data into tabular? Consider the Tables Builder feature.
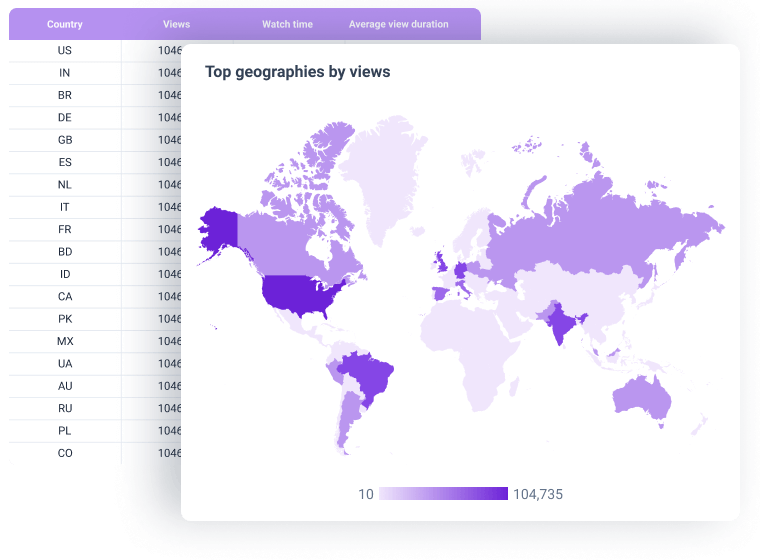
Add video stats from a YouTube channel to the SQL database. Configure the SQL query in a way so that it outputs all countries with a top number of views. Choose a Geo chart and get a great demo of the views’ statistics on a live map.
View demo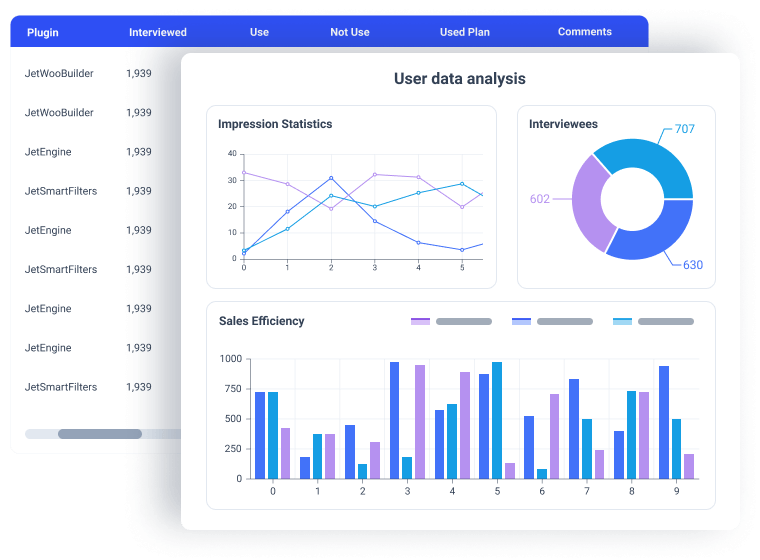
Store the survey data into a CCT. The polls can be submitted through front-end forms. Create a query to display the survey results by categories and select multiple graphs to visualize those results artfully.

Showcase the most popular topics. Use Terms Query and create two columns in the chart – Term Title and Term Post Count. The chart type you choose will output the posts’ statistics within popular categories.
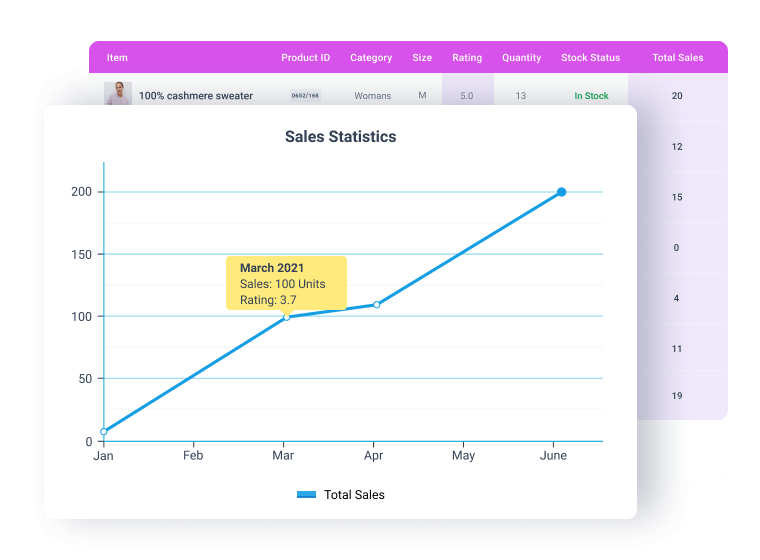
Build product charts and display all stats related to a certain product like rating, stock status, quantity, total sales, etc. You can also output the most popular products or create internal tables about the stock status for administrators.
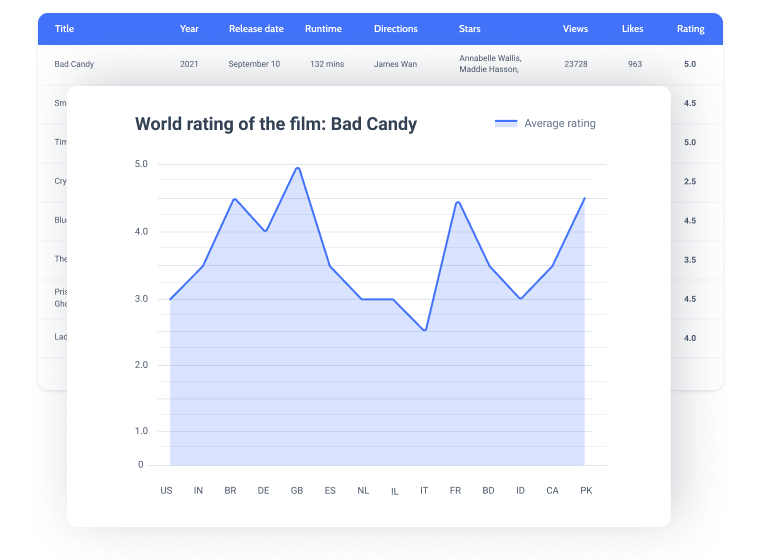
Use REST API Query to pull up-to-date data on the latest films’ ratings from one site and display it on another. Add columns comprising the movie title, its worldwide rating and get a graph with relevant information about the top films.


30 days money-back guarantee
For more details on the Subscription proceed to the Pricing page